Fundamental Field Definitions are HERE
Market-Q is moving fundamental data providers from S&P Global Market Analytics to Factset Research Systems. This move is intended to provide a stronger presentation of fundamental data within the application, which will enable more informed investment decisions.
o Company Profile: Revamped to include more relevant company snapshot information.
o Ratio Analysis: Expanded with ratio history in Annual and Quarterly time period
o Consensus Estimates: The introduction of Annual and Quarter consensus estimates for Income Statement, Balance Sheet, Cash Flow, Per Share, and Valuation.
o Ownership Coverage: Expanded from Top 50 from 10, and the introduction of Declarable Stakeholders
This new data set will be accessible from all areas in the application including:
- Fundamental Window
- Watchlist and Detailed Quote Windows
- Watchlist Screener
- Market-Q Mobile
- Excel through RTD linking
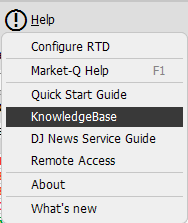
You can access the list of Fundamentals field definitions and methodologies through the Market-Q Help HERE or go to the KnowledgeBase within the Help Menu of Market-Q.

Company profile has been revamped to include more relevant company snapshot information.
A more accurate and longer business description has been added.

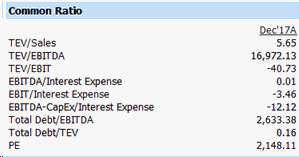
This area represents the most commonly requested ratios for the most recently reported time period for the following fields:
TEV/Sales
TEV/EBITA
TEV/EBIT
EBITDA/Interest Expense
EBIT/Interest Expense
EBITDA-CapEx/Interest Expense
Total Debt/EBITDA
Total Debt/TEV
PE

Annual and Quarterly financials have been added, which are dependent on company classification. The segment that determine the headings of the company profile are as follows:
Industrial: Revenue, Gross Income, EBITDA, EBIT, and Net Income.
Bank and Insurance: Interest Income, Net Interest Income, Non Interest Income, Loan Loss Provisions, Pretax income, and Net Income.

The Market-Q ratio summary has been updated to show Original and Restated financials for four periods in the following categories.
Profitability
Valuation
Per Share
Asset Turnover Analysis
Operating Efficiency

Consensus estimates provided by Factset are available 4 years going forward in an Annual and Quarterly basis:
Income Statement: Revenue/Sales, Operating Income, Pretax Income
Balance Sheet: Total Assets, Total Debt, Shareholder Equity
Cash Flow: Capital Expenditures, Free Cash Flow, Cash from Operations
Per Share: EPS, Dividends
Valuation: Price/Earnings, PEG Ratio, Price/Book Value, Price/Sales

Ownership has been expanded to the top 50 from top 10 for:
Shares Held
Buyers and sellers.
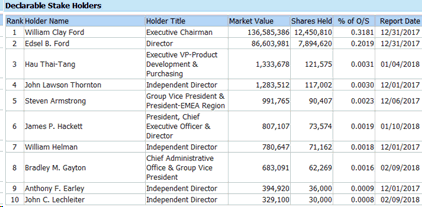
A new Declarable Stake Holders top 10 list has been added, which are people directly compensated by the company and not outside investors.

The data fields located in the Detailed Quote, Watchlist, and RTD via Excel, that were previously dependent on S&P Global as their source, are now provided by Factset Research also.