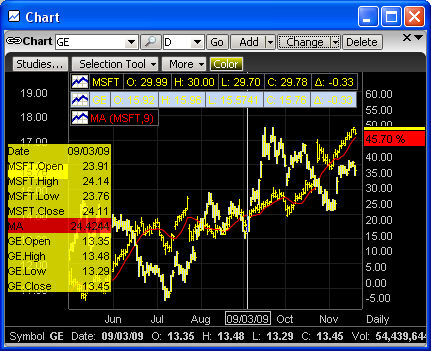
The chart header is a table that appears at the top of the chart that identifies the symbol, Open, High, Low, Close, and Change. It also shows information about all studies applied to the chart.
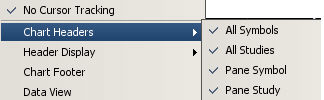
To turn Chart Headers on or off, right click anywhere in the chart, then click Chart Headers. When checked, the feature is on.
Note: Chart Headers, by default, are turned on when the charting application is opened.
You can now control the display of the Chart Headers Independently.
The 4 Modes available are:
All Symbols
All Studies
Pane Symbol
Pane Study
To turn on or off the Chart headers right click in the Chart window and select the desired Chart Headers options as shown below
A Chart Footer will show Symbol Summary information. If the user clicks on some part of the chart line then the Symbol Summary information from that point in time will be displayed.
A Chart footer can be added from the Right-Click Menu, and select Chart Footer.
![]()
This will place a Footer display at the bottom of the chart that will follow bar tracking
movements. When multiple symbols exist in a single chart window, clicking each symbol
will change the focus of the Footer.