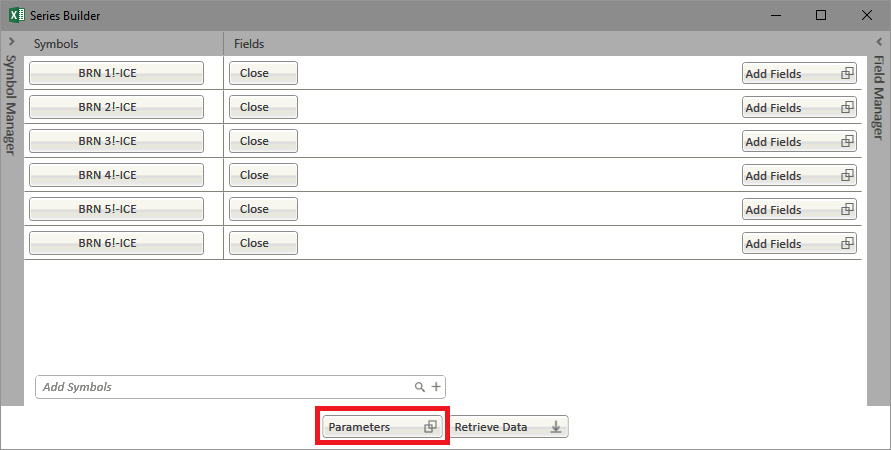
There are different parameters to help customize your Time Series output. You can get to this dialog by clicking Parameters button on the main Time Series Window.


Time Tab
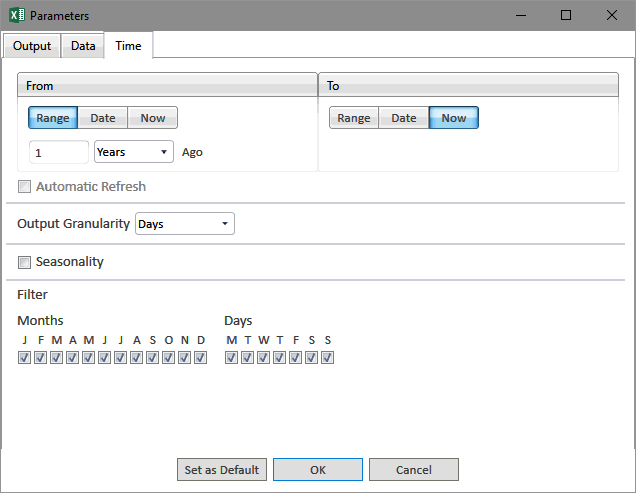
From / To |
|
Range |
Select to choose a period of time |
Date |
Select to choose a specific date |
Now |
Select to choose current day/time |
Automatic Refresh |
When enabled this allows the sheet to always display the most up-to-date values and dates of the selection |
Output Granularity |
|
Interval of time series data |
Options are seconds, minutes, hours, days, weeks, weekly average, months, and monthly average |
Seasonality |
|
Option to display data seasonally |
Select to display time series seasonally. This option stacks daily and greater granularities year-over-year, with intraday data stacked day-over-day. |
Filter |
|
Months |
Select if you want to further customize your time series to omit months |
Days |
Select if you want to further customize your time series to omit months |

Data Tab
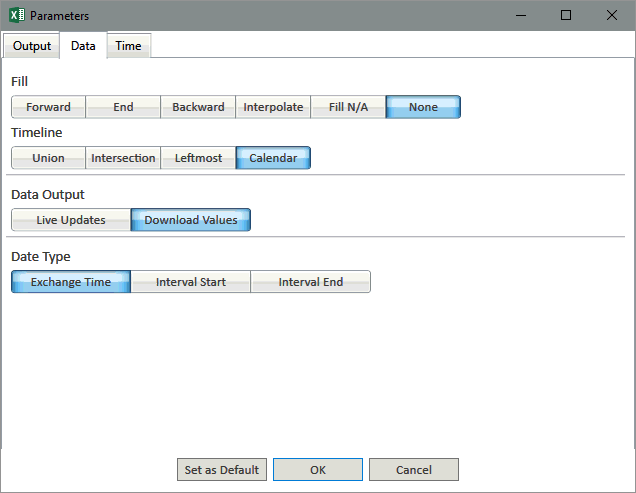
Fill |
|
Forward |
Fill's previous days data forward until there is another price available |
| End | Fills previous days data forward until the end of the selected time series |
Backward |
Fill's data backwards until there is another price available |
Interpolate |
Creates synthetic values for a span of NaN values based on the last known value and the next known value by creating linear interpolated values between them. |
| Fill NA | Fills blank cells with =NA() function which generates "#N/A" error message in cells to be ignored by charts. |
None |
No Fill is applied and weekends and holidays are empty |
Time Line |
|
Union |
Shows days when any of the selected datasets have a value |
Intersection |
Shows days when all of the selected datasets have a value |
Leftmost |
Shows days when the initial selection has a value |
Calendar |
Shows all days (default selection) |
Data Output |
|
Live Updates |
Will generate a live RTD function that will return data without the need to refresh the sheet |
Download Values |
Will return the current values of the request. Refresh options are used in order to update these values |
Date Type |
|
| Exchange Time | For some symbols you can set the Date type to Exchange time, which returns the Date/Time it was received |
| Interval Start | For some symbols you can set the Date type to Interval Start, which returns the beginning of the Date/Time that the value is referencing |
| Interval End | For some symbols you can set the Date type to Interval End, which returns the End of the Date/Time that the value is referencing |

Output Tab
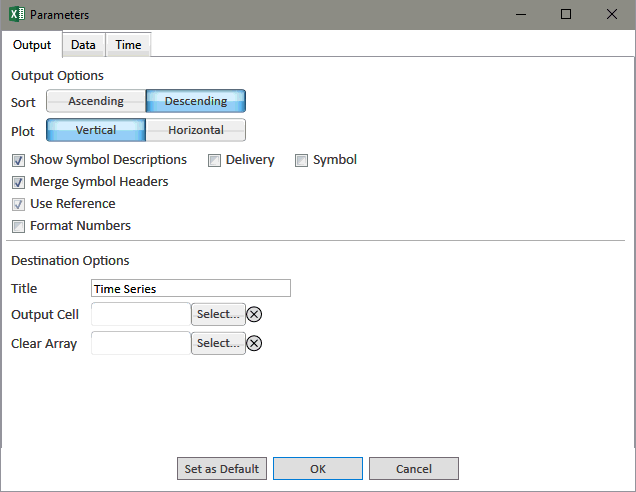
Sort |
|
Ascending |
Data will be filled to the worksheet in ascending order |
Descending |
Data will be filled to the worksheet in descending order |
Plot |
|
Vertical |
Fields will displayed vertically as rows |
Horizontal |
Fields will be displayed horizontally as columns |
Show Symbol Description |
Select to have Symbol Description as part of the time series output |
| Delivery | Select to have the Delivery as part of the time series output |
| Symbol | Select to have the underlying symbol as part of the time series output |
| Merge Symbol Headers | Merges cells with common symbol headers in the symbol array |
| Use Reference | Select Checkbox to build your Time Series with Cell References versus hard-coded symbols/fields. |
| Format Numbers | Sets the decimal formatting in the output - this does not truncate the values. |
Destination Options |
|
Title |
The label to display in the cell which contains the Time Series Function |
| Output Cell | Sets a destination output cell for placing the output array. Cell selected will be top left element in array output. |
| Output Array | Clears a range set by user before refresh. |